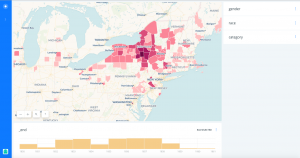
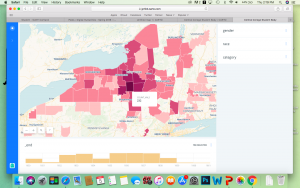
For this assignment, our group looked at what U.S. counties did the student body of the Central College came from. We used Carto to help us map this information as well as help see changes over time related to the number of students coming from counties throughout the United States. You can visit our map by clicking on the image above. The darker shaded areas have a higher number of students coming from those counties.
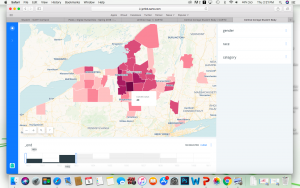
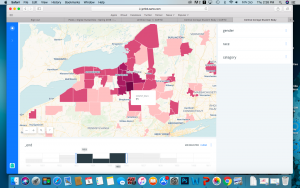
We looked at number of the students coming from NY counties to Central College during different time periods to be able to examine any changes that could have occurred in the student body. We focused on the numbers of Cortland county as they were a huge contributor to the college.
From 1850-1853 Cortland contributed 40 students from its county. From 1853-1856 Cortland contributed 71 students. Lastly, from 1856- 1861 Cortland contributed 121 students to the college.
Using Carto helps to visual data and can help to further research on many topics. By plotting this data, we are able to see that Cortland county was a main contributor to the Central College and even after the major scandal of 1853, Cortland county was still growing in its numbers of students attending the Central College. These types of digital mapping allows people to have a different perspective on data or topic or question that they may not have been able to see beforehand.
By: JP Ospina & Brianna Martin & Megan Bender


