• About
  • Who Are We?
  • The Cortland Fire of 1919
  • Textual Visualization
  • Augmented reality
  • Games!
    • Games Assignment
Digital Humanities – Spring 2018

Digital Humanities – Spring 2018

Group 4 Blog Post 1

https://amoriegreen.carto.com/builder/844a6b79-c2bb-46a2-ae54-02c5cbc2db39/embed

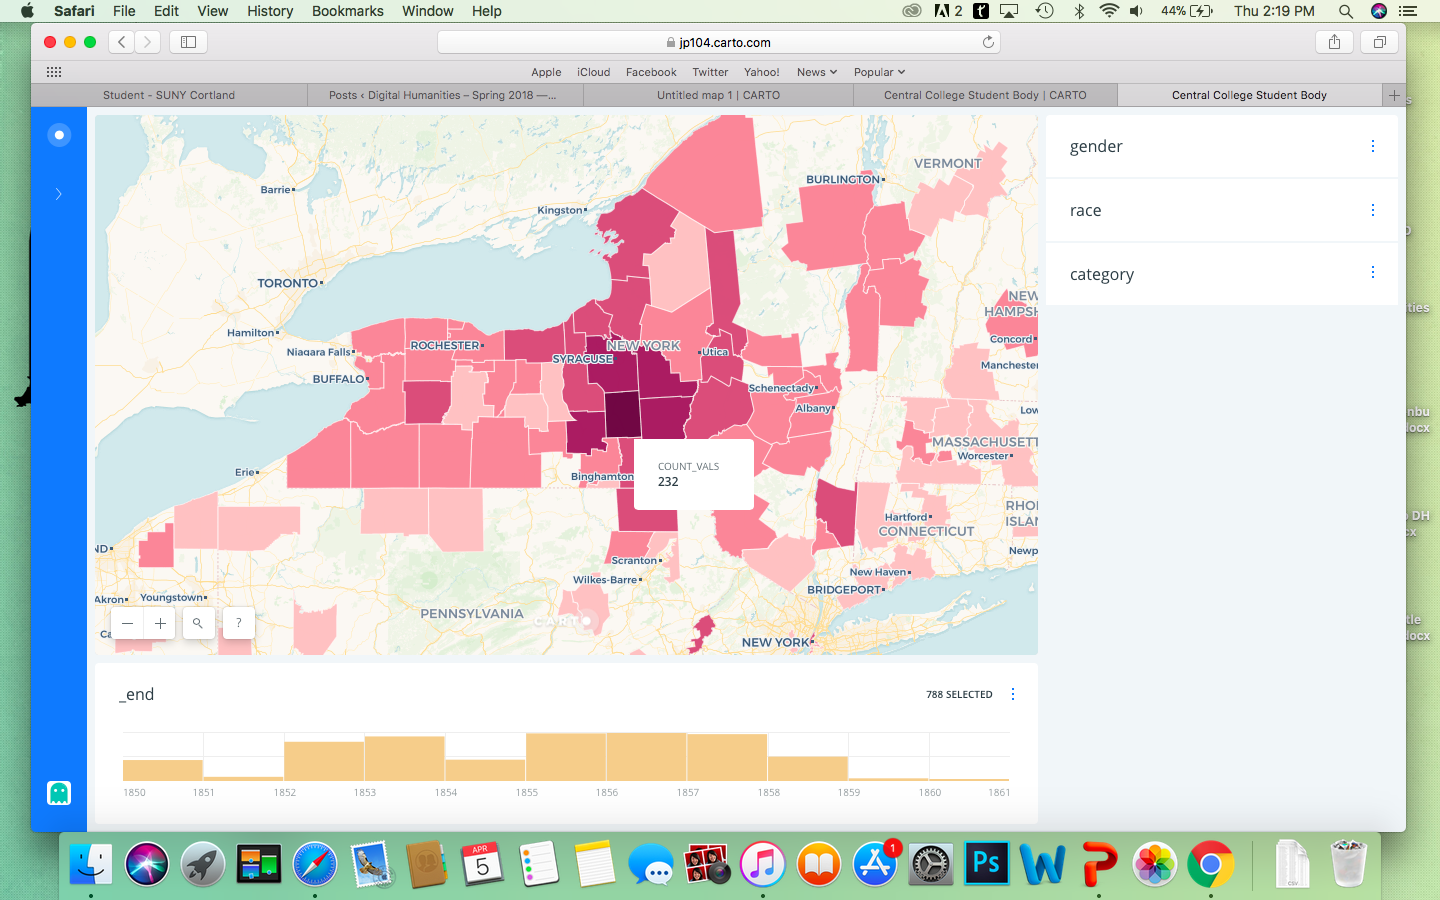
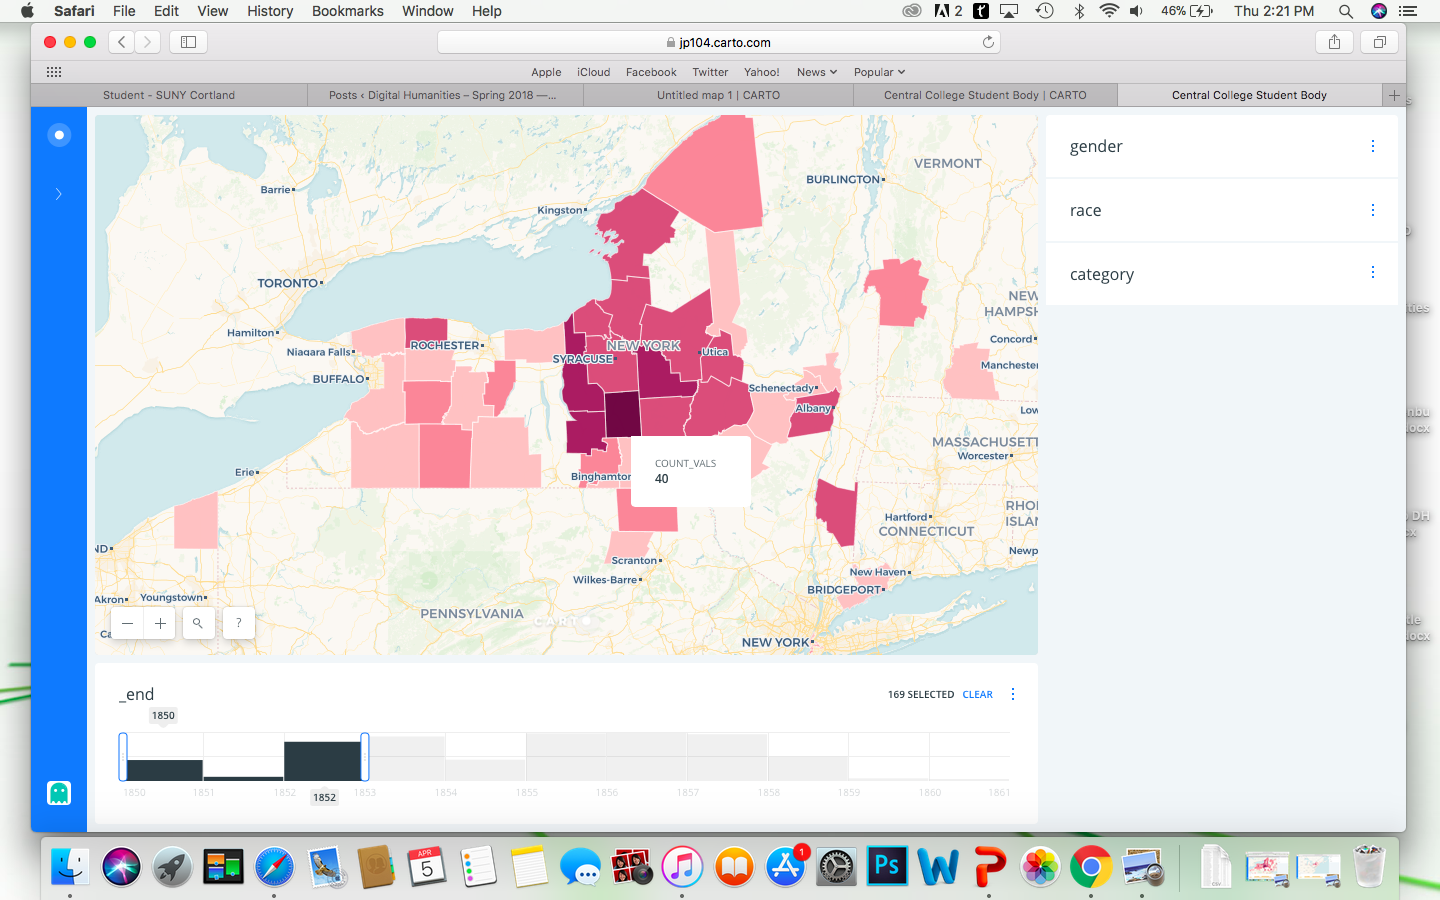
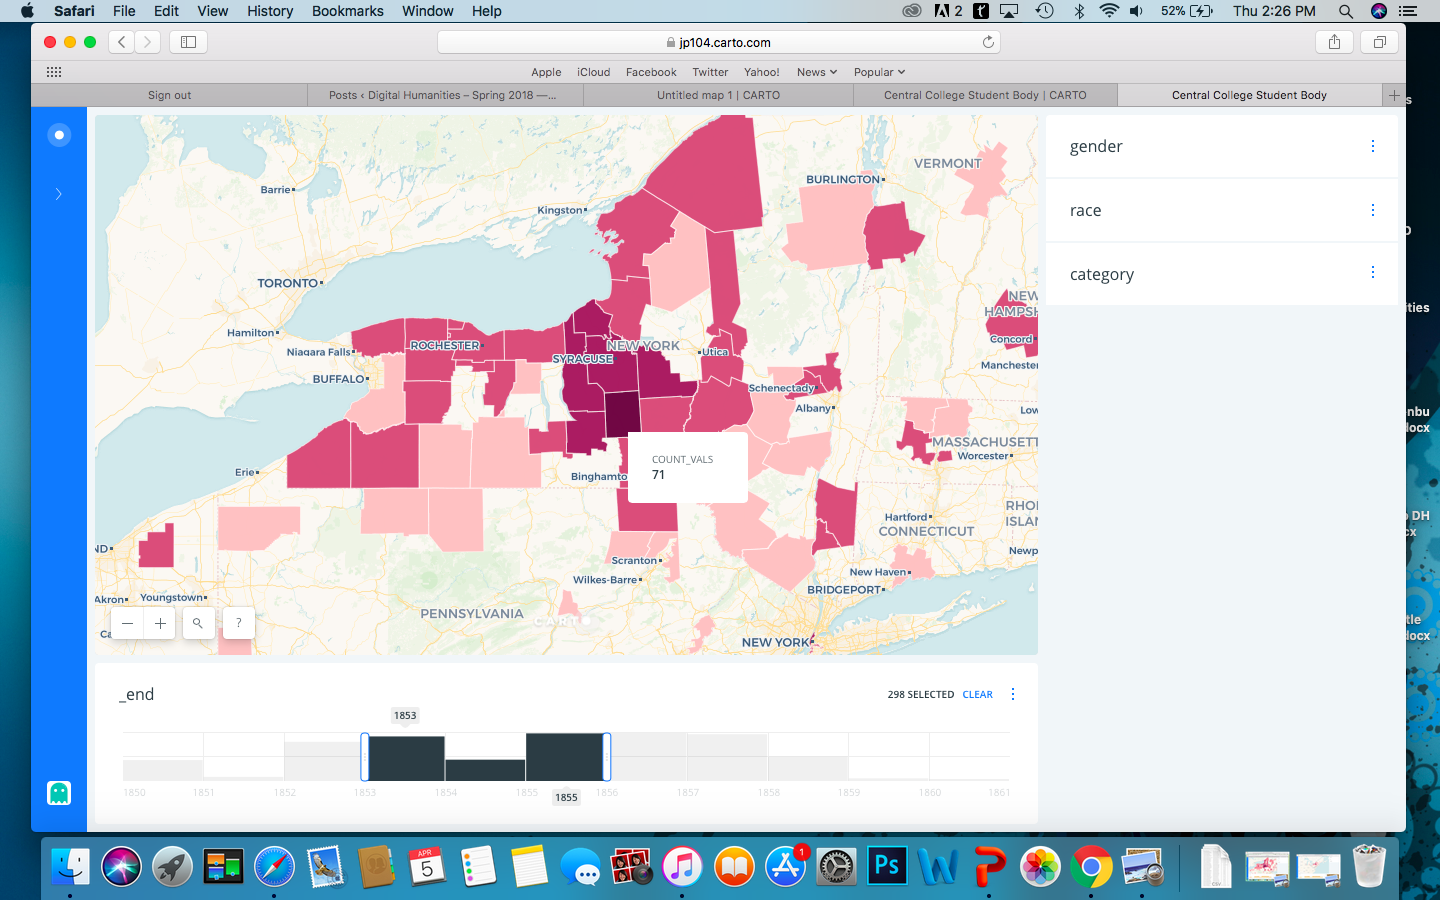
This map helped us to discover that at this time, the students of Central College contained 672 males, 360 females, and 24 unknown gender. The data displayed that there were much more male students than female students at this time, with males being almost double the amount of females. We discovered that some male students came from Cuba, Mexico, Ghana, Senegal, the United Kingdom, and Ireland, but most came from the United States, specifically the Northeast. Most female students are from the Northeast, with only one being from France; this shows that there is much less diversity of the origin of female students than male students. We also discovered that more females enrolled at the beginning of the college’s existence than the end, showing a steady decline over time; the year with the most females was 1855 with 53 enrolled at one time.

April 5, 2018

Final Blog Post Cortland Fire 1919

The research required to rediscover the story of the Cortland Fire of 1919 brought history into our own backyard. The fact that we were learning the history of the town in which we actually live, gave us a connection that we otherwise would not have had to this project. The 1919 fire was instrumental in bringing Cortland to its current incarnation. The story of it helped cement the history of the college into my own memory, and gave me a connection to this location that would not be there otherwise. The archival research aided my understanding of research methods especially here at SUNY Cortland, and the utilization of some of the finer points of WordPress allow us to visualize the fire, and also bring the story into the 21st century.

Cortland Normal School Photo; Cortland Standard; Date Unknown; SUNY Cortland Memorial Library Archive; Photograph
Cortland Normal School before the fire of 1919 that ultimately burned it down.

Zeke Johnson

4/5/18

April 5, 2018

The Central College Student Body Map

For this assignment, our group looked at what U.S. counties did the student body of the Central College came from. We used Carto to help us map this information as well as help see changes over time related to the number of students coming from counties throughout the United States. You can visit our map by clicking on the image above. The darker shaded areas have a higher number of students coming from those counties.


We looked at number of the students coming from NY counties to Central College during different time periods to be able to examine any changes that could have occurred in the student body. We focused on the numbers of Cortland county as they were a huge contributor to the college.


From 1850-1853 Cortland contributed 40 students from its county. From 1853-1856 Cortland contributed 71 students. Lastly, from 1856- 1861 Cortland contributed 121 students to the college.


Using Carto helps to visual data and can help to further research on many topics. By plotting this data, we are able to see that Cortland county was a main contributor to the Central College and even after the major scandal of 1853, Cortland county was still growing in its numbers of students attending the Central College. These types of digital mapping allows people to have a different perspective on data or topic or question that they may not have been able to see beforehand.


By: JP Ospina & Brianna Martin & Megan Bender


April 5, 2018

Mapping Benefits

What are the benefits of digital mapping for understanding the past?

Digital mapping allows historians to see patterns that a simple data set would not. For instance, in the assignment we attempted last week mapping the students who attended Central College, the goal was to try and see patterns in the living situations that perhaps a raw data set would not reveal. This process can be exceptionally valuable for figuring out different meanings of historical events to aid in constructing a narrative. A good example of mapping being used to solve a problem in history would be the cholera epidemic in Britain, where mapping was used from raw data to find the source of the outbreak, which happened to be a dirty well. With todays mapping tools, this process has become streamlined and myriad technologies exist that allow for historical data to be analyzed and mapped in new ways.

History is best understood when a clear story can be seen, mapping the tides of a battle for instance, or the representatives in a parliament, or the locations of battles within a larger war can lead to a better understanding of how wars are won, people are elected, and strategies developed. These insights are imperative if we want to become better historians as a culture.

Digital mapping is also an excellent teaching tool as it allows for students to visualize a given data set. This is important for helping children connect ideas in their heads to the real world. This connection is valuable to the learning process.

Some drawbacks with digital mapping include tedious data entry, but this is still far preferable to entering data by hand.

Zeke Johnson,

4/5/18

April 5, 2018

Civil War Deaths

Civil War Deaths Map

Above is access to our Carto map. Our intention is to visually represent those students who were casualties of the Civil War. As a comparison to the overall student body, we represented the hometowns of all students with red points. Those students who were included in the data “died in the civil war” are represented as blue points. These points are their “final residence”, or the location where they died in battle. By hovering over the blue points, one can see that some students lost their life at major battles in the Civil War, such as Gettysburg and Chancellorsville. The map is aesthetically simple yet informative, and interactive with the ability to hover over each point and know the student from New York Central College who is being represented, where they were born and if they died in the civil war.


By: Peter McKasty, Kara Smith and Monique Walsh

April 5, 2018

Sarah Delena and Emily Hatch

The majority of the white people were from the North East United States, in particular New York, with some in the United Kingdom as well. There were other states where white students originated from, like: Connecticut, New Jersey, and Massachusetts. The trend we noticed was that most white students originated from New York. (823 White Students Total)

African-American students mostly originated from the North East United States as well. there were students who originally were from Canada, Pennsylvania, Massachusetts, New York, Connecticut, one man from France (la Havre), Africa (Senegal and Benin), Ohio, Maryland, D.C., New York City, and North Carolina. The majority were in New York State however. (75 African American Students/ 2 African Students Total)

Native Americans were not represented in the population really. There were only three Native Americans in our data set: one was from Mexico, onewas from Canada (Hamilton) and the other originated from Syracuse, New York. (3 Native American Students total)

The trends were interesting to see, most students looked to be from the North Eastern United States. It was really interesting to see that the majority of minority students still came from the North East, we had figured there would be more diversity in the locations.

Below is a screenshot from our digital mapping, and the link is also embedded below for access to our digital map.

April 4, 2018

  • « Previous Page
  • 1
  • …
  • 9
  • 10
  • 11
  • 12
  • 13
  • …
  • 26
  • Next Page »

SUNY Cortland