
Zeke Johnson, Sarah Feinman, Garrett Sweeney
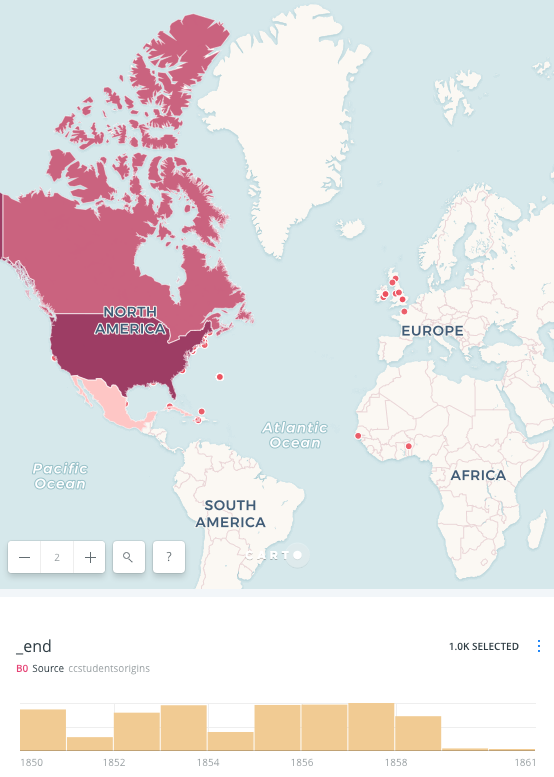
For this assignment, our group was tasked with figuring out which students that went to Central college were from outside the US. To do this was not as simple as filtering by column value, because the dataset did not inherently have a column for U.S. to Non/U.S. students. We ended up creating an overlay for the data that showed the data in terms of a colored map based on North American residency.
By organizing the data in this fashion, it is easy to see that in the second half of the college’s lifespan, more students came from abroad. The ratio of foreign born students to U.S. born students also increases after 1855.
By noticing this change over time, we can make a guess at the reasons the attendance would increase. Word about Central College probably spread as its students graduated and moved to other places. Originally two students came from Africa, and later on a handful hailed from Great Britain, and the Carribean.
Our other map lends a hand in the understanding of this phenomenon. We plotted the places that Mahommah Baquaqua, who was a student at Central College, lived in his life and found that he lived in Haiti for a time. This student’s time in Haiti could definitely have influenced the other students who came to Central College later in the 1850s.
Overall, while the ratio of students changed over time, the changes still only represented a small percentage of the overall Central College student body.
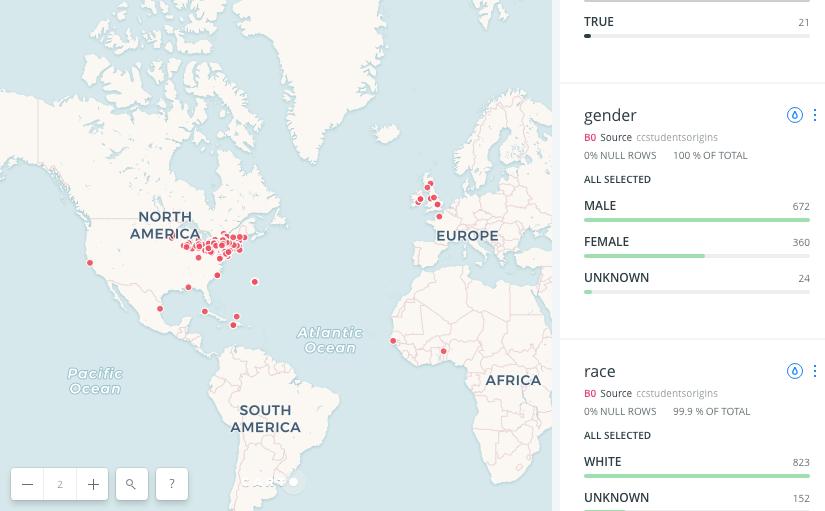
Here is our map that we used for this assignment.